
Page 130 - APICAL_SR2023
P. 130
Our
About This President’s About 2023 Apical2030 Approach to Transformative
Report Statement Apical Highlights Highlights Sustainability Partnerships
APICAL GROUP
SUSTAINABILITY REPORT 2023
INCLUSIVE PROGRESS
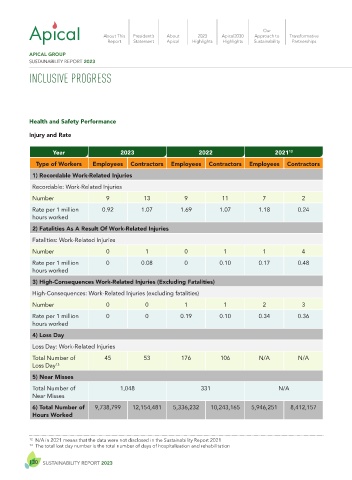
Health and Safety Performance
Injury and Rate
Year 2023 2022 2021 12
Type of Workers Employees Contractors Employees Contractors Employees Contractors
1) Recordable Work-Related Injuries
Recordable: Work-Related Injuries
Number 9 13 9 11 7 2
Rate per 1 million 0.92 1.07 1.69 1.07 1.18 0.24
hours worked
2) Fatalities As A Result Of Work-Related Injuries
Fatalities: Work-Related Injuries
Number 0 1 0 1 1 4
Rate per 1 million 0 0.08 0 0.10 0.17 0.48
hours worked
3) High-Consequences Work-Related Injuries (Excluding Fatalities)
High-Consequences: Work-Related Injuries (excluding fatalities)
Number 0 0 1 1 2 3
Rate per 1 million 0 0 0.19 0.10 0.34 0.36
hours worked
4) Loss Day
Loss Day: Work-Related Injuries
Total Number of 45 53 176 106 N/A N/A
Loss Day 13
5) Near Misses
Total Number of 1,048 331 N/A
Near Misses
6) Total Number of 9,738,799 12,154,481 5,336,232 10,243,165 5,946,251 8,412,157
Hours Worked
12 N/A in 2021 means that the data were not disclosed in the Sustainability Report 2021
13 The total lost day number is the total number of days of hospitalisation and rehabilitation
130 SUSTAINABILITY REPORT 2023 APICAL GROUP 131