
Page 75 - APICAL_SR2023
P. 75
Materiality
Assessment Appendix 1: Appendix 2: Appendix 3:
Climate Green Inclusive and Stakeholder GRI Content Assurance Glossary of
Action Innovation Progress Engagement Index Statement Terms
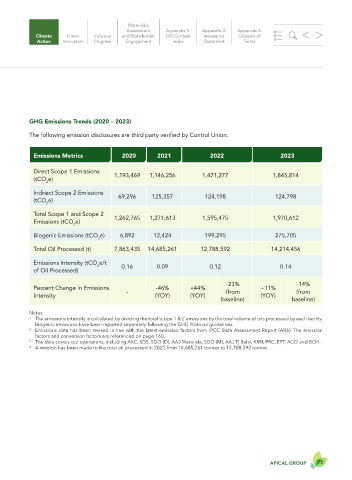
GHG Emissions Trends (2020 – 2023)
The following emission disclosures are third party verified by Control Union.
Emissions Metrics 2020 2021 2022 2023
Direct Scope 1 Emissions 1,193,469 1,146,256 1,471,277 1,845,814
(tCO e)
2
Indirect Scope 2 Emissions 69,296 125,357 124,198 124,798
(tCO e)
2
Total Scope 1 and Scope 2
1,262,765 1,271,613 1,595,475 1,970,612
Emissions (tCO e)
2
Biogenic Emissions (tCO e) 6,892 12,424 199,295 275,705
2
Total Oil Processed (t) 7,863,435 14,685,261 12,788,592 14,214,456
Emissions Intensity (tCO e/t
2 0.16 0.09 0.12 0.14
of Oil Processed)
-23% -14%
Percent Change in Emissions -46% +44% +11%
- (from (from
Intensity (YOY) (YOY) (YOY)
baseline) baseline)
Notes:
1 The emissions intensity is calculated by dividing the total scope 1 & 2 emissions by the total volume of oils processed by each facility.
Biogenic emissions have been reported separately following the GHG Protocol guidelines.
2 Emissions data has been revised in line with the latest emission factors from IPCC Sixth Assessment Report (AR6). The emission
factors and conversion factors are referenced on page 160.
3 The data covers our operations, including AKC, SDS, SDO (D), AAJ Marunda, SDO (M), AAJ Tj Balai, KRN, PRC, EFT, ACO and BOH.
4 A revision has been made to the total oil processed in 2022 from 14,685,261 tonnes to 12,788,592 tonnes.
74 SUSTAINABILITY REPORT 2023 APICAL GROUP 75