Page 116 - APICAL_SR2023
P. 116

Our
                               About This   President’s   About    2023    Apical2030   Approach to   Transformative
                                Report  Statement  Apical  Highlights  Highlights  Sustainability  Partnerships

          APICAL GROUP
          SUSTAINABILITY REPORT 2023
          INCLUSIVE PROGRESS


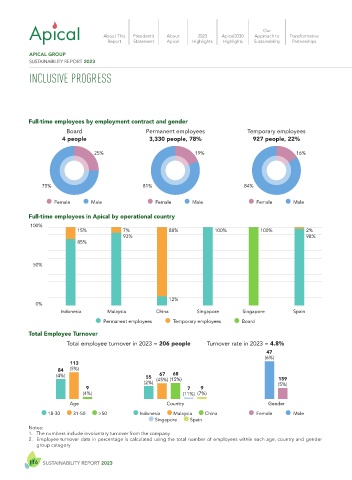
         Full-time employees by employment contract and gender
                    Board                  Permanent employees           Temporary employees
                   4 people                 3,330 people, 78%             927 people, 22%
                            25%                           19%                          16%


             75%                          81%                           84%

                  Female              Male     Female              Male      Female              Male

         Full-time employees in Apical by operational country
          100%
                       15%           7%           88%          100%         100%          2%
                                     93%                                                  98%
                       85%


           50%


                                                  12%
           0%
                   Indonesia    Malaysia      China       Singapore    Singapore      Spain
                                Permanent employees              Temporary employees              Board
         Total Employee Turnover
                    Total employee turnover in 2023 = 206 people          Turnover rate in 2023 = 4.8%
                                                                              47
                                                                              (6%)
                     113
                  84  (5%)
                                                   68
                                               67
                 (4%)                      55   (45%) (15%)                       159
                                           (2%)                                   (5%)
                          9                            7   9
                         (4%)                         (11%) (7%)
                     Age                         Country                       Gender
               18-30        31-50        >50   Indonesia        Malaysia        China     Female              Male
                                               Singapore        Spain
         Notes:
         1.  The numbers include involuntary turnover from the company
         2.  Employee turnover data in percentage is calculated using the total number of employees within each age, country and gender
            group category

          116  SUSTAINABILITY REPORT 2023                                                                                                                                            APICAL GROUP  117
   111   112   113   114   115   116   117   118   119   120   121