
Page 41 - APICAL_SR2020
P. 41
07 08 09 10 11 12 13 APICAL GROUP
Environmental Management
Energy Consumption in GHG
Quantity in GJ
2019 2020
Fuel Consumption from Non-Renewable Sources 3,196,963 5,038,060
Fuel Consumption from Renewable Sources - -
Electricity Purchased 217,245 439,944
Total Energy Consumption 3,414,208 5,478,003
Notes:
i. Data coverage for 2020 includes all our facilities except for Excelic refinery in China.
ii. Conversion factors are obtained from Biograce V 4d, 2014, Ecoinvent 3.3, ISCC 205 V 3.0.
iii. Coal makes up 89% of our total fuel consumption from non-renewable sources. Apical does not consume fuel from renewable sources.
GHG Emissions and Emissions Intensity
GHG Emissions 2019 2020
Direct Scope 1 Emissions (kgCO 2e) 359,169,064 559,032,352
Indirect Scope 2 Emissions (kgCO 2e) 31,349,697 47,427,970
Production (MT of oil processed) 5,386,248 9,158,287
Scope 1 Emissions Intensity (kgCO 2e/MT of oil processed) 67 61
Scope 2 Emissions Intensity (kgCO 2e/MT of oil processed) 6 5
Total Emissions Intensity (kgCO 2e/MT of oil processed) 73 66
Notes:
i. GHG emissions are based on the operational control approach.
ii. Data coverage for 2020 includes all our facilities except for AKC and Excelic refinery in China.
iii. Data coverage for 2019 includes SDS, AAJ Marunda, KRN, Bio-oils, AAJTB and CEP.
iv. Calculation of GHG emissions is based on the ISCC Emission 205.
v. MT of oil processed reported includes the volume of oil reprocessed and the GHG calculation methodology
refers to ISCC 205 Green House Gas Emissions version 3.0.
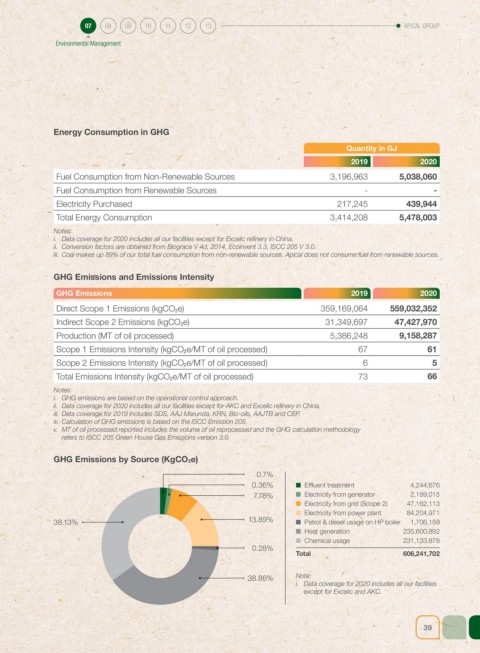
GHG Emissions by Source (KgCO2e)
0.7%
0.36% ■ Effluent treatment 4,244,676
7.78% ■ Electricity from generator 2,189,015
■ Electricity from grid (Scope 2) 47,162,113
■ Electricity from power plant 84,204,971
38.13% 13.89% ■ Petrol & diesel usage on HP boiler 1,706,159
■ Heat generation 235,600,892
■ Chemical usage 231,133,878
0.28%
Total 606,241,702
38.86% Note:
i. Data coverage for 2020 includes all our facilities
except for Excelic and AKC.
39